Platform Alerts: Health, Delivery, Acknowledgement, Export
How platform-wide health alerts are surfaced, filtered, acknowledged, and exported from the admin console
Page-aware AI
Ask AI about this page
Get answers grounded in the live Obelisk docs set, with source links, selected-text explainers, and prompts for the next document to read.
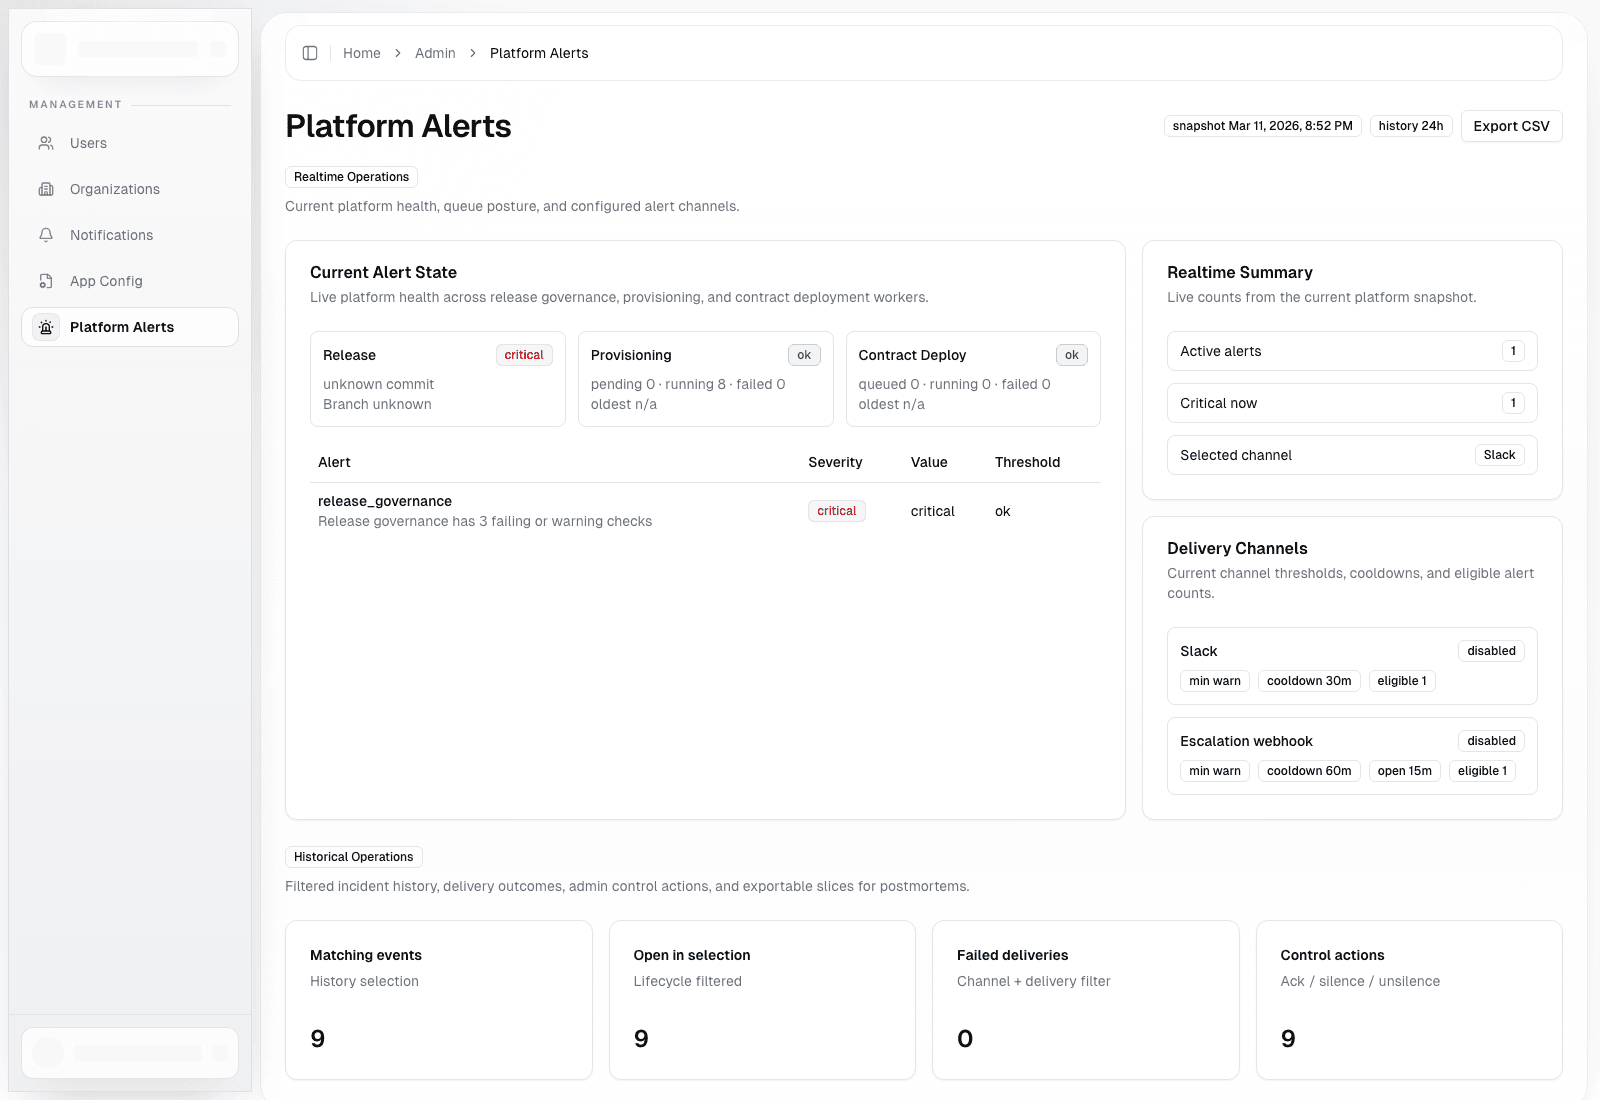
Route: /dashboard/admin/platform-alerts
This page is the platform-wide operational cockpit for queue health, release governance, alert delivery, and escalation state.
It is distinct from organization notifications:
- platform alerts are for operators and admins
- organization notifications are for tenant-facing announcements
Included Surfaces
- current alert state
- real-time summary cards
- delivery channel status
- history filters
- delivery summary
- recent alert history
- CSV export links
Available Filters
- lifecycle status:
openorresolved - severity:
warnorcritical - channel: Slack or escalation webhook
- delivery status:
delivered,failed, orskipped - audit action:
acknowledged,silenced,unsilenced - free-text alert key matching
- time window and row/export limits
Operator Actions
- acknowledge an open event
- silence an event temporarily
- clear a silence early
- export current history or summarized views
Suggested Triage Sequence
- Review the current alert state cards.
- Confirm whether the alert is platform-wide or isolated to one organization.
- Inspect recent deliveries to see if notification channels are functioning.
- Inspect audit history to confirm whether another operator already acknowledged or silenced the issue.
- Export the relevant dataset when handing off to a different team.